![]() Figures F1-F43
Figures F1-F43
![]() Tables
T1-T24
Tables
T1-T24
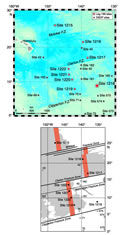
F1. Site location map.
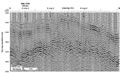
F2. Seismic reflection profile.
F3. Lithologic summary.
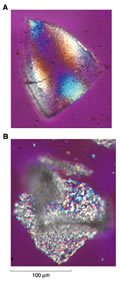
F4. Unit I manganese nodule.
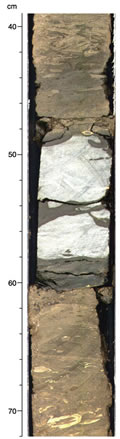
F5. Unit III chert layer.
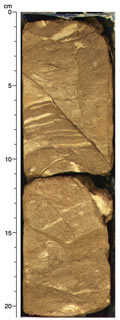
F6. Subunit IVB fault.
F7. Biostratigraphic zonation.
F8. Distribution of calcareous nannofossil taxa.
F9. Wall texture in benthic foraminifers.
F10. Magnetization intensities after AF demagnetization.
F11. Age-based ChRM directions of discrete samples.
F12. Composite magnetic stratigraphy.
F13. GRA bulk density data vs. composite depth.
F14. Magnetic susceptibility data plotted vs. composite depth.
F15. Spliced records of GRA bulk density and MS.
F16. Spliced records of GRA bulk density, magnetic susceptibility, and color reflectance parameter.
F17. Offsets applied to each core vs. depth.
F18. LSRs and chronostratigraphic markers.
F19. GRA bulk density records.
F20. MARs of sediments.
F21. Interstitial water data.
F22. Bulk-sediment data.
F23. CaCO3 and Ca data.
F24. MAD measurements.
F25. Wet and dry bulk density plotted with GRA density.
F26. LAS mineralogy determinations.
F27. Compressional wave velocity.
F28. Compressional wave velocity vs. wet bulk density.
F29. Thermal conductivity.
F30. Thermal conductivity vs. porosity.
F31. Heat flow calculation.
F32. NGR.
F33. Magnetic susceptibility.
F34. Logging operations.
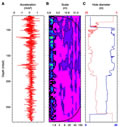
F35. Caliper, acceleration, and gamma ray logs.
F36. Gamma ray, radioactivity, and PEF logs.
F37. Data quality, WT analysis, and caliper log.
F38. Log and equivalent core physical properties.
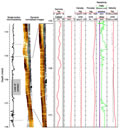
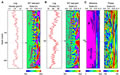
F39. FMS, geophysical, and geochemical logging data, log Unit 1.
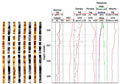
F40. Chert bands in FMS images, logging Unit 2.
F41. MGT data displaying shift in cycles, logging Unit 2.
F42. WT analyses of density and porosity logs, log Unit 1.
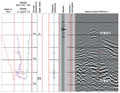
F43. Synthetic seismogram derived from velocity and density.
T1. Coring summary.
T2. Intervals of intact chert layers recovered.
T3. Distribution of calcareous nannofossil datums.
T4. Distribution of Miocene-upper Eocene planktonic foraminifers.
T5. Distribution of middle Eocene planktonic foraminifers.
T6. Planktonic foraminifer datum levels.
T7. Distribution of benthic foraminifers.
T8. Distribution of radiolarian datum levels.
T9. Composite depths of geomagnetic reversals.
T10. Core disturbance intervals.
T11. Composite depth offsets.
T12. Splice tie points.
T13. Paleomagnetic events.
T14. Nannofossil, foraminifer, and radiolarian events.
T15. Depths, ages, rates, and fluxes of sediments.
T16. Interstitial water data.
T17. Bulk-sediment data.
T18. CaCO3 and Corg data.
T19. Moisture and density measurements.
T20. LAS-based mineralogy.
T21. Split-core velocity measurements.
T22. Thermal conductivity.
T23. In situ temperature.
T24. Logging operations.