![]() Figures
F1-F33
Figures
F1-F33
![]() Tables T1-T13
Tables T1-T13
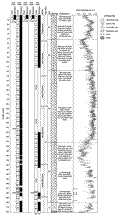
F1. Lithostratigraphic summary.
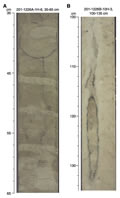
F2. Site 1226 features.
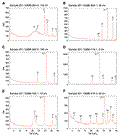
F3. Examples of XRD analyses.
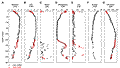
F4. Dissolved species in interstitial waters.
F5. MBIO subsampling, Hole 1226B.
F6. MBIO subsampling, Hole 1226E.
![]()
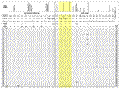
F7. Prokaryotic cells enumerated.
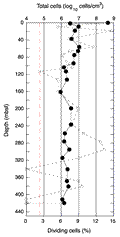
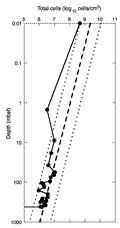
F8. Total prokaryotic profile.
F9. "Biscuit."
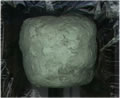
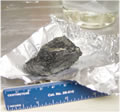
F10. Basalt from an XCB core catcher.
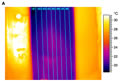
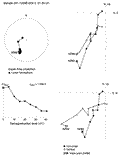
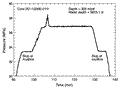
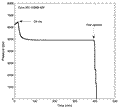
F11. Lines and core liner temperature profiles.
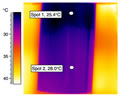
F12. IR scan of void at end of core.
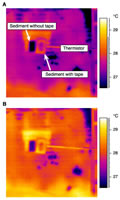
F13. Sediment emissivity using tape as control.
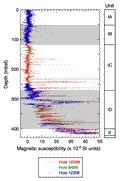
F14. MST magnetic susceptibility.
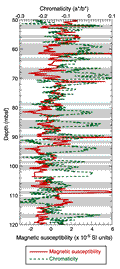
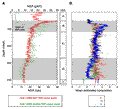
F15. Reflectance and magnetic susceptibility.
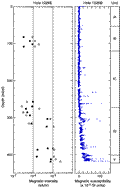
F16. Magnetic intensity and susceptibility.
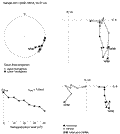
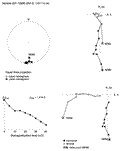
F17. Principal component analysis, 201-1226E-18H-6, 55-57 cm.
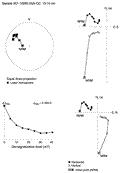
F18. Principal component analysis, 201-1226E-22X-3, 31-33 cm.
F19. Principal component analysis, 201-1226E-25X-3, 112-114 cm.
F20. Principal component analysis, 201-1226E-25X-CC, 13-15 cm.
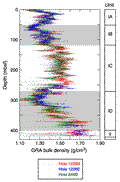
F21. Comparison of GRA density among holes.
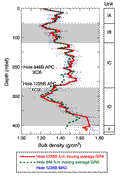
F22. GRA and MAD bulk density.
F23. Mass/volume MAD measurements.
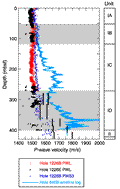
F24. P-wave velocity, Sites 1226 and 846.
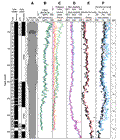
F25. NGR and radioactive element profiles.
F26. Thermal conductivity measurements.
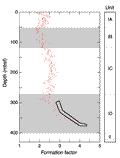
F27. Formation factor profile.
F28. Temperature vs. depth.
F29. DVTP-P pressure.
F30. PCS pressure.
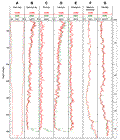
F31. Main logs.
F32. Comparison between logs, Holes 1226B and 846B.
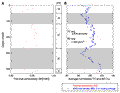
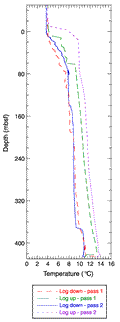
F33. Hole 1226B temperature log.
T1. Coring summary.
T2. Basalts, Holes 846B and 1226B.
T3. Dissolved species.
T4. Iron concentrations.
T5. Methane in headspace.
T6. Hydrogen concentrations.
T7. C, N, and S.
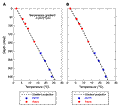
T8. Contamination based on PFT.
T9. Potential contamination of slurries based on PFT.
T10. Potential contamination of slurries based on beads.
T11. Media inoculated with material from Site 1226.
T12. Downhole temperature measurements.
T13. Logging operations.