![]() Figures F1-F20
Figures F1-F20
![]() Tables T1-T4
Tables T1-T4
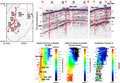
F1. Tectonic setting of Hydrate Ridge.
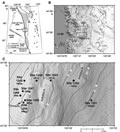
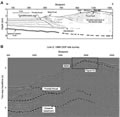
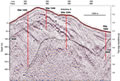
F2. Line drawing of the crustal structure across Hydrate Ridge.
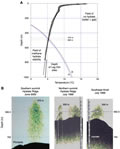
F3. Water temperature profiles and echo sounder records from southern Hydrate Ridge.
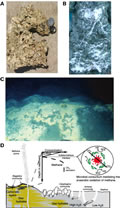
F4. Biogeochemical setting of Hydrate Ridge.
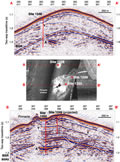
F5. East-west vertical slice through the 3-D seismic data.
F6. North-south-trending vertical slices from the 3-D seismic data volume.
F7. Seismic details near the summit of southern Hydrate Ridge.
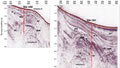
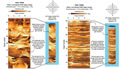
F8. East-west-trending vertical slices through the seismic data around Sites 1251 and 1252.
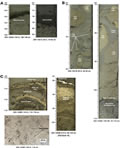
F9. Examples of some of the characteristic lithologic features observed during Leg 204.
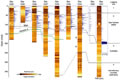
F10. Summary of biostratigraphic and lithologic observations.
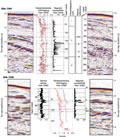
F11. Correlation between 3-D seismic data, density, and resistivity measured downhole.
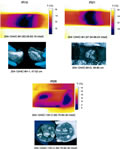
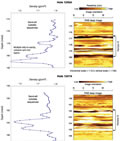
F12. Comparison of IR images and hydrate samples extracted from the core liner.
F13. Relative borehole resistivity compared to the presence of low temperature anomalies in recovered cores.
F14. Comparison of the resistivity structure between Sites 1244 and 1248.
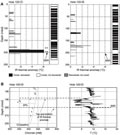
F15. Chloride concentration values measured at all sites.
F16. C1/C2 values from vacutainer samples measured at all sites.
F17. Methane concentrations determined from PCS measurements.
F18. Density and RAB recorded through seismic Horizon A at Sites 1245 and 1247.
F19. Sulfate and methane concentration showing the SMI.
F20. IR thermal anomalies and comparison between chloride anomalies.
T1. Estimated depth to major seismic horizons.
T2. Leg 204 site summary.
T3. Leg 204 coring summary.
T4. Operations summary.