![]() Figures F1-F14
Figures F1-F14
![]() Appendix
Figures AF1-AF3
Appendix
Figures AF1-AF3
![]() Tables
T1-T3
Tables
T1-T3
F1. Location of Hole 735B.
F2. Schematic diagram showing the lithostratigraphy of Hole 735B as a function of depth.
F3. P-wave seismic velocity model.
F4. Caliper, compressional wave velocity, bulk density, and porosity logs as a function of depth.
F5. Compressional wave and shear wave velocity as a function of depth.
F6. Effect of crack porosity on both compressional wave and shear wave velocities.
F7. Velocity and density relationship for samples from Hole 735B.
F8. Deformation in mylonitic zones.
F9. Diagram showing variations in QP, QS1, and QS2 vs. depth in Hole 735B below 600 m.
F10. Downhole logs showing the FMS pad 1 azimuth, the fast angle azimuth, and the average anisotropy.
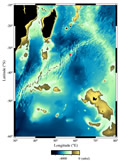
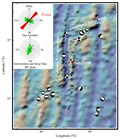
F11. Bathymetric map showing the Atlantis II Fracture Zone and surrounding area.
F12. Compressional wave and shear wave synthetic seismograms from logging data collected during Leg 176.
F13. Correlation between the compressional wave synthetic seismograms and the geochemical, density, velocity, porosity, and resistivity logs obtained in Hole 735B during Legs 118 and 176.
F14. Correlation between Leg 176 synthetic seismograms produced with logging data collected during Leg 176 and VSP results from the experiment carried out during Leg 118.
AF1. Schematic diagram showing the orientation with respect to the ODP core system of the samples used for laboratory measurements.
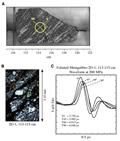
AF2. A representative plot documenting the computations for each sample.
AF3. Processed cross-dipole shear wave data.
T1. Index properties, compressional wave and shear wave velocities, attenuation, mineralogy, and deformation information.
T2. Statistical analyses of QP, QS1, and QS2 measurements.
T3. Average core and log measurements, Hole 735B.