![]() Figures F1-F48
Figures F1-F48
![]() Tables
T1-T22
Tables
T1-T22
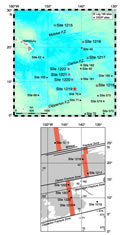
F1. Site location map.
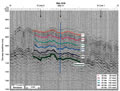
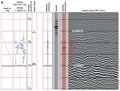
F2. Seismic reflection profile.
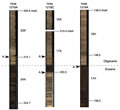
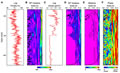
F3. Core recovery, corresponding lithologic units, and age, Holes 1219A and 1219B.
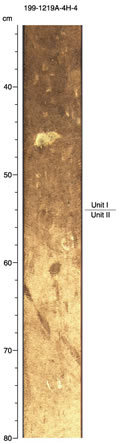
F4. Unit I-II transition.
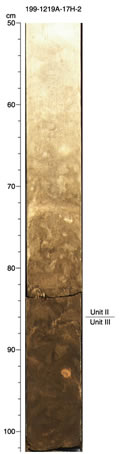
F5. Unit II-III transition.
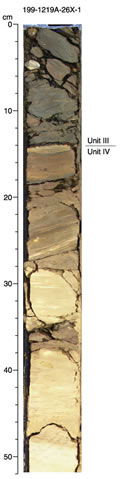
F6. Unit III-IV transition.
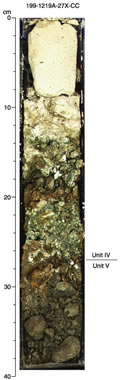
F7. Unit IV-V transition.
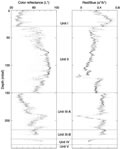
F8. Lightness and red/blue spectral data.
F9. Cores from the upper Eocene-lower Oligocene.
F10. Lithologic columns, Sites 1218 and 1219.
F11. Lithologic columns showing the major units plotted vs. depth and age.
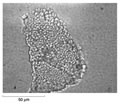
F12. Photomicrograph of the radial wall texture of Epistominella exigua.
F13. Magnetization intensities after AF demagnetization.
F14. Magnetically soft overprint used to reorient cores.
F15. Magnetostratigraphy of the upper 12 mcd, Hole 1219A.
F16. Composite magnetic stratigraphy.
F17. GRA bulk density plotted vs. composite depth.
F18. MS plotted vs. composite depth.
F19. Color reflectance data plotted vs. composite depth.
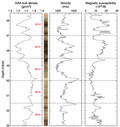
F20. Spliced records of GRA bulk density, MS, and color reflectance parameter vs. composite depth.
F21. Spliced records of Sites 1218 and 1219 GRA bulk density, MS and the color reflectance parameter vs. Site 1218 composite depth.
F22. LSR and chronostratigraphic markers.

F23. Density record of site survey piston Core EW9709-12P compared to density record of Site 1219.
F24. Bulk MARs of sediments.
F25. Interstitial water data.
F26. Bulk-sediment data.
F27. CaCO3 and Ca data.
F28. MAD measurements.
F29. GRA density, PWL velocity, and MS vs. color cycles.
F30. Wet and dry bulk density plotted with GRA density.
F31. LAS mineralogy determinations.
F32. Compressional wave velocity.
F33. Compressional wave velocity vs. wet bulk density.
F34. Thermal conductivity.
F35. Thermal conductivity plotted with porosity.
F36. Heat flow calculation.
F37. Natural gamma radiation.
F38. Magnetic susceptibility.
F39. Logging operations.
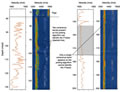
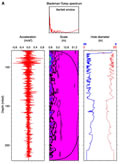
F40. Caliper, acceleration, and gamma ray logs.
F41. Example of the problem encountered in identifying P-waves.
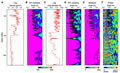
F42. Log and equivalent core physical properties.
F43. MGT and FMS-sonic data quality, WT analysis, and caliper logs.
F44. WT analyses of density and hole diameter logs.
F45. Gamma ray, radioactivity, and PEF logs.

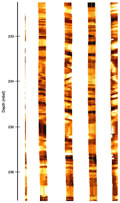
F46. Chert bands in FMS images, logging Unit 3.
F47. WT analyses of porosity and density logs.
F48. Synthetic seismograms derived from velocity and density.
T1. Coring summary.
T2. Distribution of calcareous nannofossil datums.
T3. Distribution of Oligocene and Miocene planktonic foraminifers.
T4. Distribution of early Eocene planktonic foraminifers with symbols.
T5. Planktonic foraminifer datum levels.
T6. Distribution of benthic foraminifers.
T7. Distribution of radiolarian datum levels.
T8. Core disturbance intervals.
T9. Composite depth offsets.
T10. Splice tie points.
T11. Paleomagnetic events.
T12. Nannofossil, foraminifer, and radiolarian events.
T13. Depths, ages, rates, and fluxes of sediments.
T14. Interstitial water data.
T15. Bulk-sediment data.
T16. CaCO3 and Corg data.
T17. Moisture and density measurements.
T18. LAS-based mineralogy.
T19. Split-core velocity measurements.
T20. Thermal conductivity.
T21. In situ temperature.
T22. Logging operations, Hole 1219A.