![]() Figures F1-F54
Figures F1-F54
![]() Tables
T1-T24
Tables
T1-T24
F1. Postdrilling interpretation for local seismic profile AGSO 202-5, across Site 1171.
F2. Regional cross section through time across Site 1171.
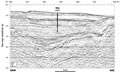
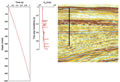
F3. Portion of seismic profile AGSO 202-05 through Site 1171.
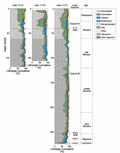
F4. Summary of lithostratigraphic units, biozonation, carbonate content, and physical properties.
F5. Detailed summary for the 0-958.8 mbsf interval.
F6. Lithologic composition of Holes 1171A, 1171B, and 1171C sediments.
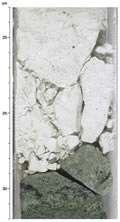
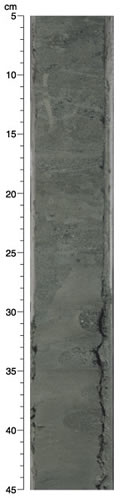
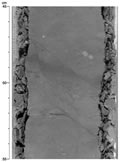
F7. Close-up photograph of the striking lithologic contact between Units II and III.
F8. Lithologic composition of Hole 1171D sediments.
F9. Comparison of chromaticity coordinate a* from the photospectrometer to carbonate content and the nannofossil percent, 400-500 mbsf.
F10. Comparison of chromaticity coordinate a* from the photospectrometer to carbonate content and the nannofossil percent, 450-700 mbsf.
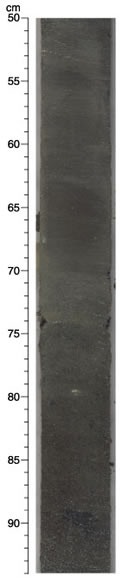
F11. Close-up photograph of a sharp bioturbated surface.
F12. Close-up photograph of a thin black sediment bed containing abundant shells
F13. Close-up photograph of microfaults with an offset cutting bioturbated claystone.
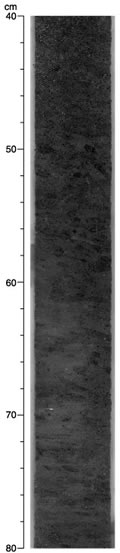
F14. Close-up photograph of a distinct surface that separates a massive very dark grayish brown clay from a glauconitic dark grayish brown clay.
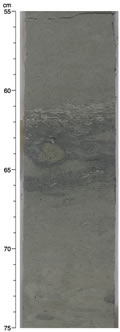
F15. Close-up photograph of the surface of Section 189-1171D-71R-2.
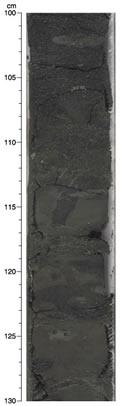
F16. Close-up photograph of a distinct well-defined surface at the base of Subunit VA, which is interpreted as a basal sequence boundary.
F17. Close-up photograph of a sharp, although heavily bioturbated and irregular, surface.

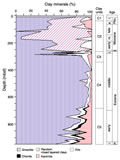
F18. Clay mineral units.
F19. Age-depth plot and linear sedimentation rates.
F20. Combined biostratigraphic interpretation of the Eocene-Oligocene transition.
F21. Correlations between Holes 1171A, 1171B, and 1171C based on calcareous nannofossil biostratigraphy.
F22. Benthic foraminiferal assemblages and inferred paleodepths.
F23. The age-depth plot and linear sedimentation rates for the composite sections for the last 12 m.y.
F24. Long-core measurements from 0 to 120 mbsf.
F25. Long-core measurements from 120 to 240 mbsf, Hole 1171C.
F26. Long-core measurements from 400 to 950 mbsf, Hole 1170D.
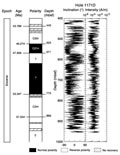
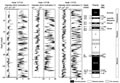
F27. Variation of magnetic properties, Holes 1171A, 1171C, and 1171D.
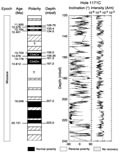
F28. Age-depth relationship from paleomagnetic data for the Neogene, Hole 1171C.
F29. Smoothed GRA bulk density and spectral reflectance data for the upper 118 mcd, Holes 1171A, 1171B, and 1171C.
F30. Plots of carbonate, total organic carbon, total nitrogen, C/N ratios, and hydrogen index values.
F31. Total sulfur content compared to C/S ratios.
F32. Tmax values generated from Rock-Eval pyrolysis analyses of organic matter.
F33. Methane and dissolved sulfate concentrations, methane vs. ethane plus propane ratio, and percent wetness from headspace gas analysis.
F34. Concentration-depth profile of Cl- compared to methane and Na+ compared to Na+/Cl- ratios.
F35. Concentration-depth profiles of SO42-, pH, alkalinity, and NH4+.
F36. Concentration-depth profiles of Sr2+, Ca2+, and Li+.
F37. Concentration-depth profiles of Mg2+ and K+.
F38. Concentration-depth profile of dissolved silica within interstitial water.
F39. Magnetic susceptibility, GRA density, and wet bulk density vs. depth, Hole 1171A.
F40. P-wave velocities measured for discrete samples and in whole cores vs. depth.
F41. P-wave velocities measured for discrete samples vs. depth.
F42. Thermal conductivity vs. depth.
F43. Temperature vs. depth.
F44. Undrained shear strength from miniature vane-shear measurements vs. depth, Hole 1171A.
F45. Wet bulk density, water content, and porosity measured at discrete intervals vs. depth.
F46. Details of the logging operations, Hole 1171D.
F47. Caliper, medium resistivity, porosity, density, and photoelectric effect values, Hole 1171D.
F48. Total gamma-ray and spectral gamma-ray values, Hole 1171D.
F49. Downhole log bulk density plotted with core bulk density.
F50. Downhole density porosity and neutron porosity plotted with core porosity.
F51. Time/depth, P-wave velocity, and seismic data.
F52. Downhole density plotted against natural gamma.
F53. Detailed downhole spectral gamma-ray, porosity, density, photoelectric effect, and resistivity logs.
F54. Downhole spectral gamma-ray data for Th and Blackman-Tukey power spectrum of Th.
T1. Coring summary.
T2. Lithostratigraphic summary.
T3. Identification and abundances of nannofossils.
T4. Calcareous nannofossil datum levels.
T5. Range chart of planktonic foraminifers.
T6. Core depths of selected planktonic foraminiferal datums.
T7. Core depths of selected radiolarian datums.
T8. Relative abundance of selected diatom taxa, sponge spicules, and silicoflagellates.
T9. Relative abundance of selected diatom taxa, sponge spicules, and silicoflagellates, Hole 1171D.
T10. Diatom bioevents identified, Holes 1171A, 1171C, and 1171D.
T11. Distribution of organic walled dinocysts and palynomorph percentages.
T12. Selected dinocyst events.
T13. Biostratigraphic events identified.
T14. Magnetostratigraphic results.
T15. Composite depth section.
T16. Splice tie points.
T17. Values for inorganic carbon, calcium carbonate, total carbon, total organic carbon, total nitrogen, total sulfur, and hydrogen.
T18. Results of Rock-Eval pyrolysis analyses.
T19. Headspace gas composition.
T20. Interstitial water data.
T21. P-wave velocities measured at discrete intervals.
T22. Thermal conductivity measured on whole-core sections, Hole 1171A.
T23. Undrained shear strength from miniature vane-shear measurements, Hole 1171A.
T24. Moisture and density measured at discrete intervals.