![]() Figures F1-F64
Figures F1-F64
![]() Tables
T1-T15
Tables
T1-T15
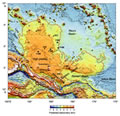
F1. Predicted bathymetry of the Ontong Java Plateau.
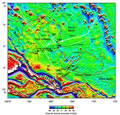
F2. Free-air gravity map of the Ontong Java Plateau region.
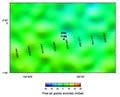
F3. Site 1186 location and site-survey data.
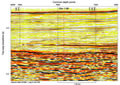
F4. MCS reflection profile.
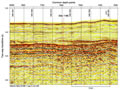
F5. MCS reflection profile.
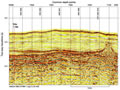
F6. MCS reflection profile.
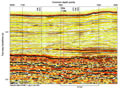
F7. MCS reflection profile.
F8. Lithostratigraphy and downhole log summary properties.
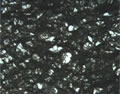
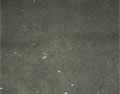
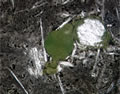
F9. Foraminifer packstone, Unit II.
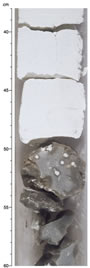
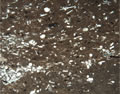
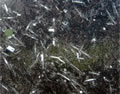
F10. Interbedded nannofossil limestone and chert, Unit II.
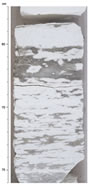
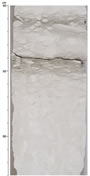
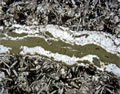
F11. Partial chert formation in nannofossil limestone, Unit II.
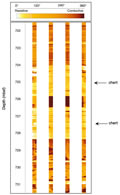
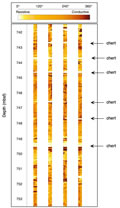
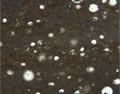
F12. Chert horizons from FMS image.
F13. Chert horizons from FMS image.
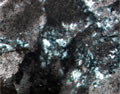
F14. Zeolitic chalk bands, Unit II.
F15. Abundant foraminifers in upper Maastrichtian chalk, Subunit IIIA.
F16. Foraminifer nannofossil chalk with banding, Subunit IIIA.
F17. Nannofossil chalk of Campanian age, Subunit IIIA.
F18. Condensed transition zone of claystone and clayey chalk.
F19. Microfacies of bioturbated limestone, Subunit IIIA/IIIB transition.
F20. Bioturbated limestone with superimposed mottle, Subunit IIIB.
F21. Radiolarian clayey limestone microfacies, Subunit IIIB.
F22. Microfacies of nannofossil limestone with foraminifers, Subunit IIIB.
F23. Diagenetic compaction features, Subunit IIIB.
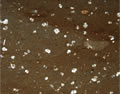
F24. FMS image.
F25. Bioturbated limestone above chert interval, Subunit IIIB.
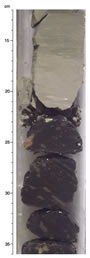
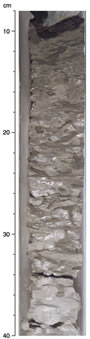
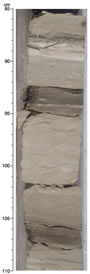
F26. Sediment succession above basalt lava flows.
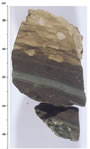
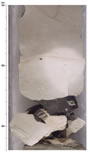
F27. Limestone pebble conglomerate between basalt flows.
F28. Microfacies of limestone conglomerate between basalt flows.
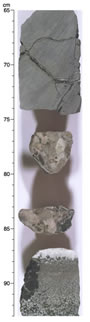
F29. Partially recrystallized limestone breccia filling fissure in basalt.
F30. Hole 1186A basement summary diagram.
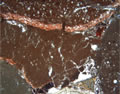
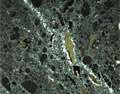
F31. Textural variation within massive part of Unit 4.
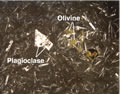
F32. Olivine and plagioclase phenocrysts in aphanitic pillow margin.
F33. Abundance of phenocryst phases.
F34. Part of fine-grained patch.
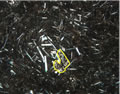
F35. Pillow margin showing plagioclase laths around olivine phenocryst.
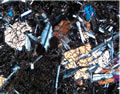
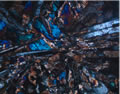
F36. Variolitic texture of plagioclase and clinopyroxene.
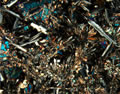
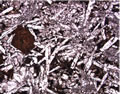
F37. Typical intergranular texture.
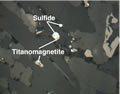
F38. Plagioclase crystal with sulfide inclusions.
F39. Olivine phenocryst replaced by smectite.
F40. Total alkalies vs. silica.
F41. Zr vs. TiO2.
F42. Cr vs. TiO2.
F43. TiO2 vs. Mg#.
F44. Replacement of olivine phenocrysts in a halo.
F45. Replacement of euhedral olivine phenocryst.
F46. Replacement of groundmass by celadonite in halo.
F47. Celadonite and calcite vein with halos.
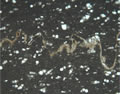
F48. Interstitial chalcedony among calcite spherules.
F49. Zijderveld diagrams.
F50. Magnetic polarity data and correlation with GPTS.
F51. Paleomagnetic unit-mean ChRM inclination, MDF, and M.
F52. AF demagnetization, Zijderveld diagram, and decay of NRM.
F53. Index properties and thermal conductivity vs. depth.
F54. Velocity data and whole-core measurements vs. depth.
F55. Magnetic susceptibility profiles.
F56. Composite of wireline logs.
F57. FMS image of limestone age transition.
F58. Wireline logs composite.
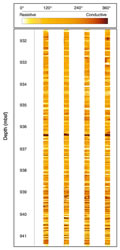
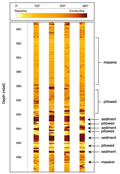
F59. Igneous basement logged by FMS.
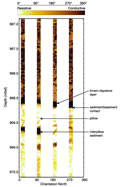
F60. Sediment/basement contact and pillow basalt shown by FMS image.
F61. Massive and pillow basalt and sedimentary interbeds.
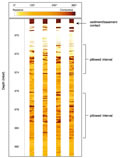
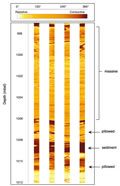
F62. Sedimentary interbeds between pillow basalt shown by FMS.
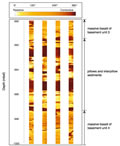
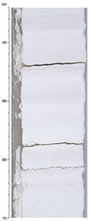
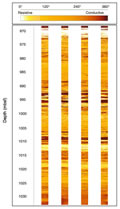
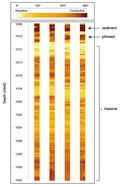
F63. Lava flows and interbed shown by FMS, 997 to 1012 mbsf.
F64. Interbed and lava flows shown by FMS, 1008 to 1032.
T1. Coring summary.
T2. Expanded coring summary.
T3. Lithologic units.
T4. Components of sediments.
T5. Summary of depths and estimated duration of unconformities.
T6. Cenozoic planktonic foraminifer and calcareous nannofossil occurrences.
T7. Cretaceous planktonic foraminifer and calcareous nannofossil occurrences.
T8. Geochemical data for rock samples from Hole 1186A.
T9. Properties of basalt pieces.
T10. Paleomagnetic Units I-VIII.
T11. Properties of sediment cores and basalts.
T12. Index properties data.
T13. P-wave velocity.
T14. Thermal conductivity values.
T15. Logging operations summary.