![]() Figures F1-F32
Figures F1-F32
![]() Tables
T1-T15
Tables
T1-T15
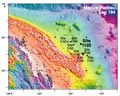
F1. Bathymetry map.
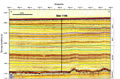
F2. Seismic line MAR04.
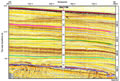
F3. Multichannel line MAR15.
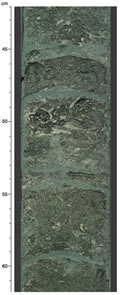
F4. Lithologic summary.
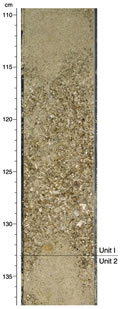
F5. Close-up photograph of a coarse and poorly sorted skeletal-rich floatstone.
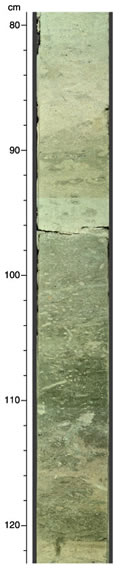
F6. Close-up photograph showing a glauconite-rich layer from Subunit IIA.
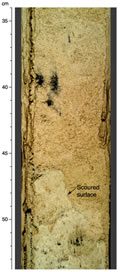
F7. Close-up photograph showing a scoured surface from Subunit IIC.
F8. Close-up photograph showing alternation of skeletal packstone and mudstone.
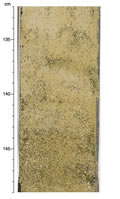
F9. Close-up photograph showing greenish gray sand with glauconite.
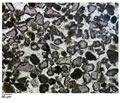
F10. Photomicrograph of a siltstone to sandstone with pitted quartz.
F11. Long-core measurements from Hole 1195A.
F12. Long-core measurements from Hole 1195B.

F13. Comparison of the observed magnetic stratigraphy with the geomagnetic polarity timescale.
F14. Age-depth model and sedimentation rates.
F15. Interstitial water chemistry.
F16. Dissolved magnesium vs. calcium.
F17. Carbonate and noncarbonate mineral percentages.
F18. Carbon, HI, and sulfur plots.
F19. GRA and MAD bulk density.
F20. Bulk density, grain density, porosity, and comparison of original and remeasured grain density and residual porosity.
F21. P-wave velocity.
F22. Crossplot of velocity vs. porosity.
F23. Average thermal conductivity.
F24. Crossplot of porosity and thermal conductivity.
F25. Comparison of magnetic susceptibility, carbonate content, natural gamma radiation, and color reflectance.
F26. Depth offset between Holes 1195A and 1195B.
F27. Comparison between the color reflectance parameter a*, the MST-NGR, the HNGS gamma radiation data, magnetic susceptibility, and glauconite-rich units.
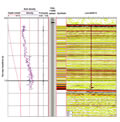
F28. Downhole logging data.
F29. Comparison of core measurements and downhole logs.
F30. Log spectral gamma ray data showing potassium, thorium, and uranium concentrations.
F31. Temperature profile.
F32. Synthetic seismogram plotted on line MAR15.
T1. Coring summary.
T2. Expanded coring summary.
T3. Lithologic units.
T4. Biostratigraphic datums.
T5. Summary of paleoenvironmental interpretations.
T6. Magnetic polarity transitions.
T7. Age-depth control points.
T8. Age picks.
T9. Headspace gas composition.
T10. Interstitial water chemistry.
T11. Aragonite, calcite, dolomite, and noncarbonate mineral percentages.
T12. Carbon, nitrogen, sulfur, and hydrogen results.
T13. Rock-Eval pyrolysis results.
T14. Summary of logging operations.
T15. Stations of the check shot survey.