![]() Figures F1-F50
Figures F1-F50
![]() Figures
F51-F94
Figures
F51-F94
![]() Tables
T1-T25
Tables
T1-T25
F51. Alteration halos per core.
F52. XRF analyses.
F53. Chemical composition of altered pale green sample.
F54. Chemical composition of altered hyaloclastite.
F55. Chemical composition of an alteration halo along a vein, Sample 185-801C-36R-4.
F56. Chemical composition of an alteration halo along a vein, Sample 185-801C-37R-6, 33-35 cm.
F57. Shipboard magnetic susceptibility measurements.
F58. Intensities of NRM.
F59. Inclination vector of NRM.
F60. Inclination vector of the untreated remanent magnetization.
F61. Demagnetization diagrams.
F62. Inclinations plotted against depth below seafloor.
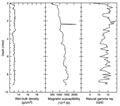
F63. Index properties and compressional wave velocities.
F64. Crossplots of data from igneous section.
F65. MST measurements vs. depth.
F66. MST data for Hole 801D.
F67. Thermal conductivity vs. depth.
F68. Cores and cored intervals correlated to logs.
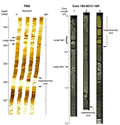
F69. FMS microresistivity correlated to core images.
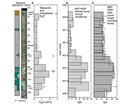
F70. Radioactive element logging measurements in Jurassic basement in Hole 801C.
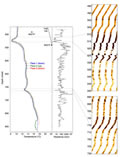
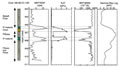
F71. Geophysical logging measurements in Jurassic basement in Hole 801C.
F72. Magnetic measurements in Jurassic basement and deviation from true vertical in Hole 801C.
F73. Downhole temperature and FMS data.
F74. Perfluoro(methylcyclohexane) in igneous rock samples.
F75. Comparison of perfluoro(methylcyclohexane) in rock samples.
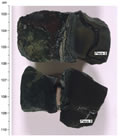
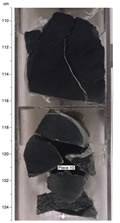
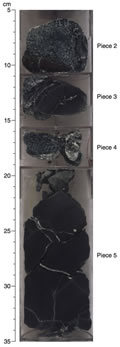
F76. Core containing pillow basalts with interpillow material.
F77. Glassy pillow rim.
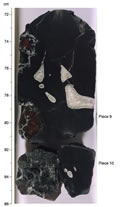
F78. Pillow basalts and intrapillow breccia.
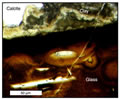
F79. Glass, clay, and calcite shown in photomicrograph.
F80. Basalt flow with fractures and veins.
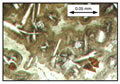
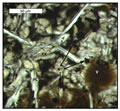
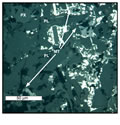
F81. Plagioclase, pyroxene, and magnetite grains.
F82. Interpillow glass, carbonate, and clay.
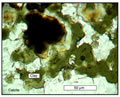
F83. Calcite matrix enclosing clay and iron oxides.
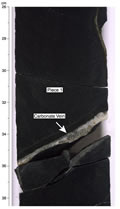
F84. Calcite vein in lava flow.
F85. Plagioclase, pyroxene, and titanomagnetite with secondary sulfides.
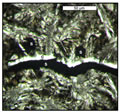
F86. Microcrystalline groundmass with filled fracture.
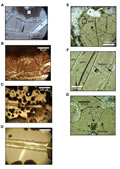
F87. Photomicrographs of glass samples.
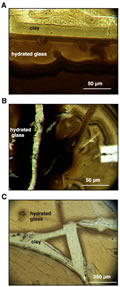
F88. Examples of glass alteration fronts.
F89. Time and temperature record of water sampling runs.
F90. Water temperatures in Hole 801C.
F91. Comparison between MST and K2O data.
F92. MST-NGR and core K2O data for Section 185-801C-14R-3.
F93. Calibration of MST-NGR measurements.
F94. K2O vs. depth.
T1. Coring summary.
T2. Expanded coring summary.
T3. Radiolarian taxa.
T4. Igneous core description log.
T5. Location of volcanic glass.
T6. Summary of primary mineralogy.
T7. Shipboard XRF analyses.
T8. Vein types.
T9. Volatile and alkali data vs. depth.
T10. Alkali budget estimate.
T11. Physical properties of discrete samples.
T12. Compressional wave velocity on split cores.
T13. Thermal conductivity values.
T14. Chemical composition of interstitial waters.
T15. Microbiology and tracer tests.
T16. Cores sampled for in situ microbiological cultures.
T17. Thin sections examined for microbial alteration.
T18. Thin sections in fluorescent microsphere tests.
T19. Cores analyzed for PFT microbiological contamination studies.
T20. WSTP data.
T21. WSTP aliquot distribution.
T22. Cell counts of WSTP water.
T23. K2O analyses.
T24. MST and AA data for NGR.
T25. Hole averages for MST-NGR and K2O data.