![]() Figures F1-F36
Figures F1-F36
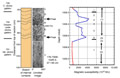
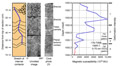
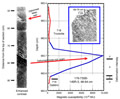
F1. Leg 118 downhole log magnetic susceptibility vs. depth.
F2. Effects of gaps at piece edges and machine saturation on magnetic susceptibility.
F3. Magnetic susceptibility of minicores vs. MST.
F4. Edited MST magnetic susceptibility.
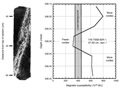
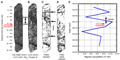
F5. Magnetic susceptibility for a typical peak region, 70-706.5 mbsf.
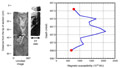
F6. Magnetic susceptibility for two peak regions, 652-662 mbsf.
F7. Magnetic susceptibility, 1071-1084 mbsf.
F8. Thicknesses of peaks and peak regions, 500-1500 mbsf.
F9. Percent peaks and percent background measurements, 500-1500 mbsf.
F10. Background magnetic susceptibility, 500-1500 mbsf.
F11. Average background magnetic susceptibility by core, 500-1500 mbsf.
F12. Merged magnetic susceptibility log, Hole 735B.
F13. Oxide gabbro, oxide gabbronorite, and oxide olivine gabbro.
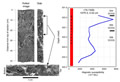
F14. Magnetic susceptibility, 652.5-654.5 mbsf.
F15. Magnetic susceptibility, 1008.1-1009.1 mbsf.
F16. Magnetic susceptibility, 1032.6-1033.3 mbsf.
F17. Prominent felsic vein.
F18. Felsic material filling fractures and surrounding angular fragments.
F19. Felsic vein with oxide-rich gabbro.
F20. Deformed oxide gabbro seam.
F21. A narrow mylonite/ultramylonite zone.
F22. Oxide gabbro with three magnetic susceptibility peaks.
F23. Slab samples with felsic veinlets or vein nets cementing breccias.

F24. Coarse pegmatitic breccia with high magnetic susceptibility.
F25. Histogram of number of veins vs. magnetic susceptibility.
F26. 10% least-squared weighted curves of magnetic susceptibility vs. depth.
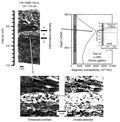
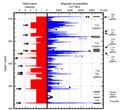
F27. Vein-log spreadsheet information.
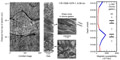
F28. Comparison of magnetic susceptibility with crystal-plastic deformation intensity.
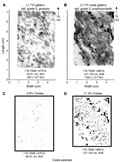
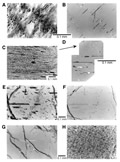
F29. Scans of oversized thin sections from deformed rock.
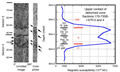
F30. Upper contact of deformed region.
F31. Magnetic susceptibility histogram for strongly deformed rock.
F32. Chemical relationships between gabbros and minerals.
F33. Magnetic susceptibility vs. TiO2 and MgNo.
F34. Photomicrographs of magnetite.
F35. FeO vs. An for plagioclase phenocrysts.
F36. Magnetic susceptibility vs. olivine composition.